Let’s Search the Data Using Splunk

Big Data!
In today’s world, humans and machines generate vast amounts of data every second. This data, when analyzed correctly, can provide deep sights to help make our lives better. Due to the humongous size of data, humans cannot analyze and take appropriate decisions accordingly in the desired time limit. This is where I introduce you to “Splunk!”
Splunk Capabilities
Splunk offers amazing capabilities of monitoring, analyzing and visualizing data at large scale. Splunk provides the ability to ingest large amounts of data and extract useful information from them. It uses this information for creating dashboards, panels, reports and alerts, and has the inbuilt ability to extract any type of logs of websites, devices, APIs, sensors in any format like CSV, JSON, XML, etc. which can be static or real-time data. There are many useful features available in Splunk, some of which are mentioned below:
Monitoring: Splunk allows you to monitor terabytes of data. It provides a powerful SPL (Search Processing Language) to monitor huge log files and extract fields of interest from them. You can forward data from different devices, ingest data into your Splunk, and monitor that data in real-time.
Alerts: Splunk provides an alert mechanism to intimate users about critical events and sends those alerts via email, message or other such options. Splunk even allows to define customized alert actions.
Search: Splunk offers the ability to apply free-form searches and investigate log files, raw events, and statistical information using its SPL and eventually convert the results into charts.
Report: Splunk allows users to easily create real-time reports that can be scheduled to run at any pre-defined intervals and these reports can be shared with other users.
Dashboards and Visualizations: Splunk offers powerful capabilities to rich dashboards and visualization that helps consolidate data from various reports to portray a particular use case with drill-down capability. Splunk provides support for using JavaScript for custom visualizations and 3rd party JavaScript libraries for dashboards.
Let’s Get Started with Splunk!!!
You can download Splunk from official Splunk website and install it quickly in a few easy steps. After installation, you can access Splunk web UI using http://localhost:8000 URL. Splunk allows you to ingest various types of data whether it is from a static file, streaming data, web feed or data generated using your own script. Information about how to get your data in can be found here.
Once the data ingested into Splunk we can start searching. By default, Splunk provides Search and Reporting app to search, filter & analyze indexed data. Splunk Search Processing Language (SPL) is used for searching data from Splunk. You can search by typing keywords in the search bar, like Error, Login, Logout, Failed, etc.
Let’s do it step by step
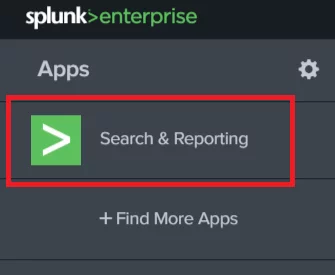
After Logging in into your Splunk instance, you can see the Search & Reporting app on the left side.
Click on the Search & Reporting app to get into the app. You can see Search bar with time range picker. Using this Search bar you can search event within a particular time-frame.
I have already ingested access logs in my Splunk instance. Now I want to see all those logs with error keyword. For that, type ERROR in the search bar and press the search button.
Here, Splunk is returning all the logs with error keyword.
Splunk has an inbuilt mechanism for extracting fields from any logs. So let’s search using field name. Now I want to see all logs having method field having “POST” as a value.
Type method=POST in the search bar and hit the enter key.
If we need statistics for method field like count of events.
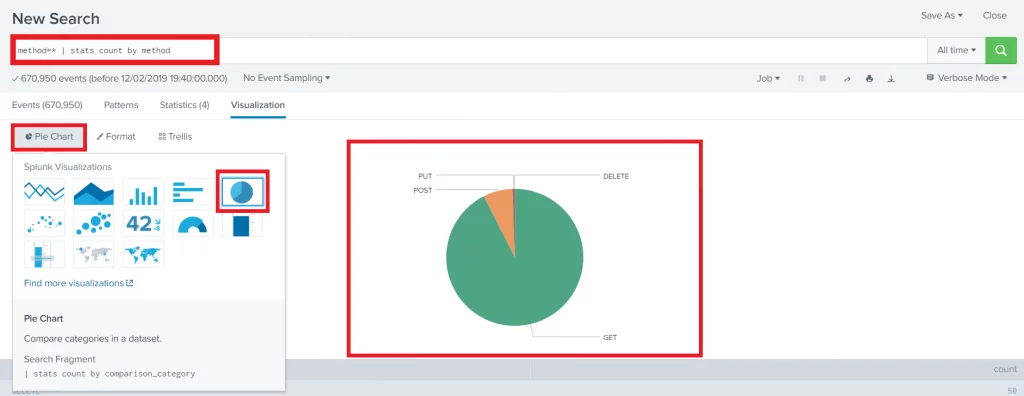
Type method=* | stats count by method in the search bar and search.
In this search, we have used method=* for considering only those events which have method field, stats command generates summary statistics in the tabular format. Using field name as a filter is the best practice for filtering events. There are other best practices of Splunk searches which we will discuss in upcoming blogs.
Now click on the visualization tab. You can see the Splunk Visualization with multiple visualization options. Select the Pie chart option.
You can save your designed searches as a report and use it in dashboards. Here is a list of commands available in Splunk. By using these commands you can create search, report, and visualization of your data which can be used in multiple dashboards.
We will see how to create an interactive dashboard in Splunk in the upcoming blogs.
Also read: An introduction to Splunk Search Processing Language


